Illustrating Decisions (in healthcare)
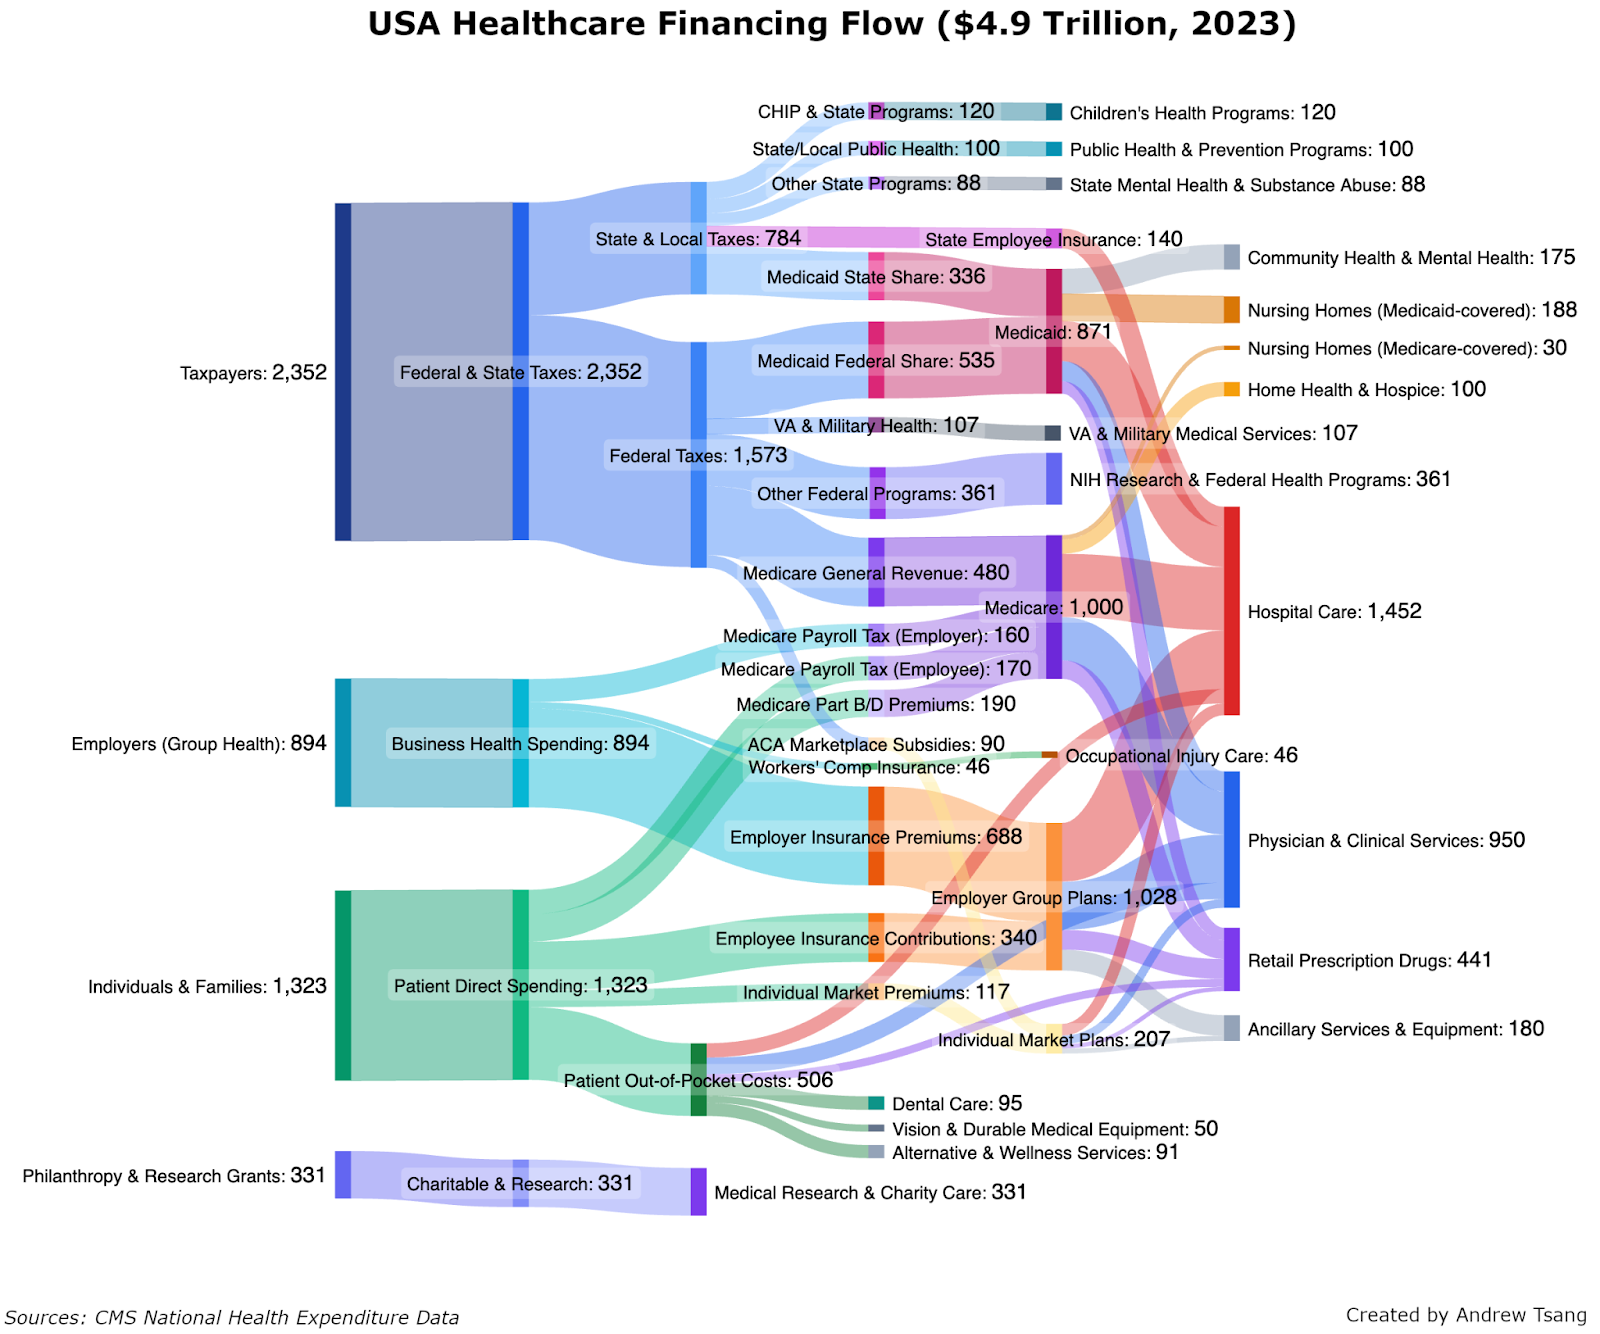
I deeply enjoyed reading this article by Andrew Tsang that illustrates the flow of funds through different country’s healthcare systems.
What really stands out is how he phrases the analysis as uncovering the collective choices and values that the systems embody. This choice-based analysis works well with the visual metaphor in the Sankey diagram: each involves branching!
I like that the use of static images for the subsection call-outs in the observations on the US system. This is often done with with scrollytelling, using static images instead fits with my desires to flip between things in my own order.
To improve the diagram, I would try to stabilize the colors more: in the call-outs, sections are colored differently than they are in the combine diagram. There is some standardization between sections (nursing homes are orange..usually) but I would use that more. The worst offender is the diagram in the Workers pay at least twice, which changes colors from the main diagram but never refers to any colors to guide you! Then in the next section, the same colors are used for different things. If the base diagram could be restructured to implicitly keep those colors, it would make it easier to relate each targeted diagram back to it. I consider this a quibble, the diagrams remain understandable throughout.
Header image originally sourced from the source article. I could not find terms, so I’m the original author is OK with me posting a copy here and saying (again) that I think its an effective image and a good read.